|
|
Elcometer Viscosity Master Software
|
Product Description :
Viscosity Master™ Software
Viscosity Master™ is the powerful, yet easy to use software supplied with all Elcometer 2300 Rotational Viscometers.
Specifically designed to maximise the versatility and usability of the viscometer, data can be stored along with associated photographs, test notes and all related test information.
There are two operating modes: manual and automatic.
In manual mode, measurements are recorded as they are taken by the instrument, but the viscometer is not controlled by the software.
In PC controlled (automatic) mode (available on -R model viscometers), measurements are recorded and the viscometer can be controlled by the software via a PC. When running a batch in automatic mode, the viscometer will start and stop under the control of ViscosityMaster™ and measurements and charts are shown in real time.
|
ViscosityMaster™ makes it easy to collate and use the data recorded. Whether the data is required for analysis or to create professional reports for distribution to customers or colleagues, ViscosityMaster™ can deliver. With
inbuilt report templates and easy access to all data, images and other associated files, ViscosityMaster™ makes managing data quick and easy.
The end result is a software package supplied with the Viscometer which can be fully tailored to meet specific requirements, producing detailed reports in landscape or portrait format quickly, easily and effectively.
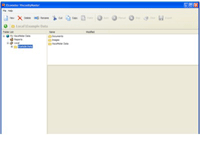
The ViscosityMaster™ software has been designed to be familiar and intuitive to any PC user. It is simple to batch all associated files and folders, create new batches or reports and programme the viscometer.
An example batch is pre-loaded into the software helping the user to discover all the features available. |
 |
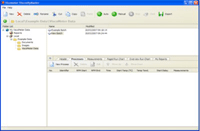
The Process Wizard will ask the user to define process variables such as Identifier, Start RPM, End RPM, Time etc. On input of the information required, select ‘Finish’ and the new process will appear in the ‘Processes’ tab window.
Once the particular test procedure has been defined, it is simple to create as many processes as are required. |
 |
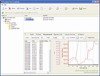
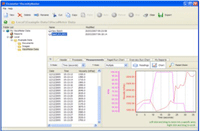
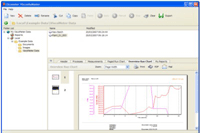
Viewing measurement data and producing standard reports is achievable in just a few clicks.
The user can zoom in on an area of the chart, view multiple batches simultaneously, view thumbnails of your report or see the report page by page.
Customising the display window makes ViscosityMaster™ even quicker to use. Viewing tabs can be added or deleted to suit the particular test methods and reporting procedures. |
 |
Custom reports are produced with report wizards and page designers.
Aside from the measurements and charts, the user can include photographs, images, Word documents etc. When complete, this can be saved and exported as a PDF or a JPEG image and e-mailed as an attachment anywhere that is required. |
 |
|
|